

Technical Analysis
Daily and weekly technical analysis of the major pairs and commodities.
The analyses and news published here are sourced from third parties; the company has neither prepared nor reviewed them. They do not represent the company's view and are not offered as approved or indicative analysis. The company does not advise making any trading decision based on them and accepts no liability for any information they contain.
Currencies & commodities 07-10-2026
EURUSD
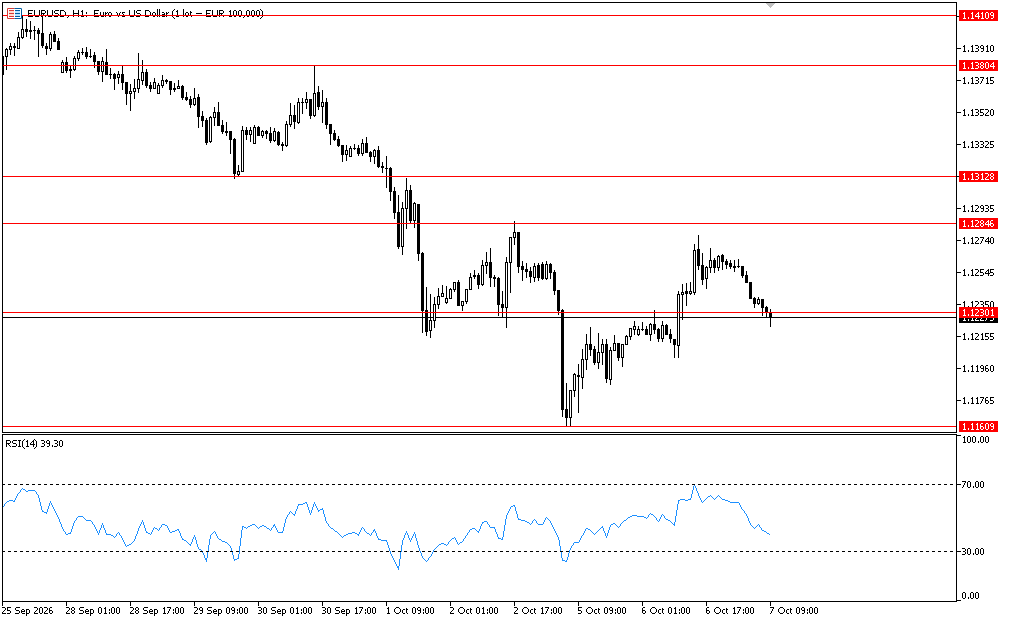
The pair moves inside a downtrend in the one-hour timeframe. It is currently being traded below level 1.1230 which is a horizontal resistance level in the hourly timeframe, which by holding below it will support the continuity of the downtrend and will target level 1.1160 then 1.1130. The RSI indicator shows the probability of continuing the downtrend by rebounding down off level 70 the overbought area.
The bearish scenario will be canceled by breaking upwards through level 1.1285.
Resistance levels:
1.1285, 1.1310, 1.1380, 1.1410
Support levels:
1.1160, 1.1130, 1.1060, 1.0990
WTI
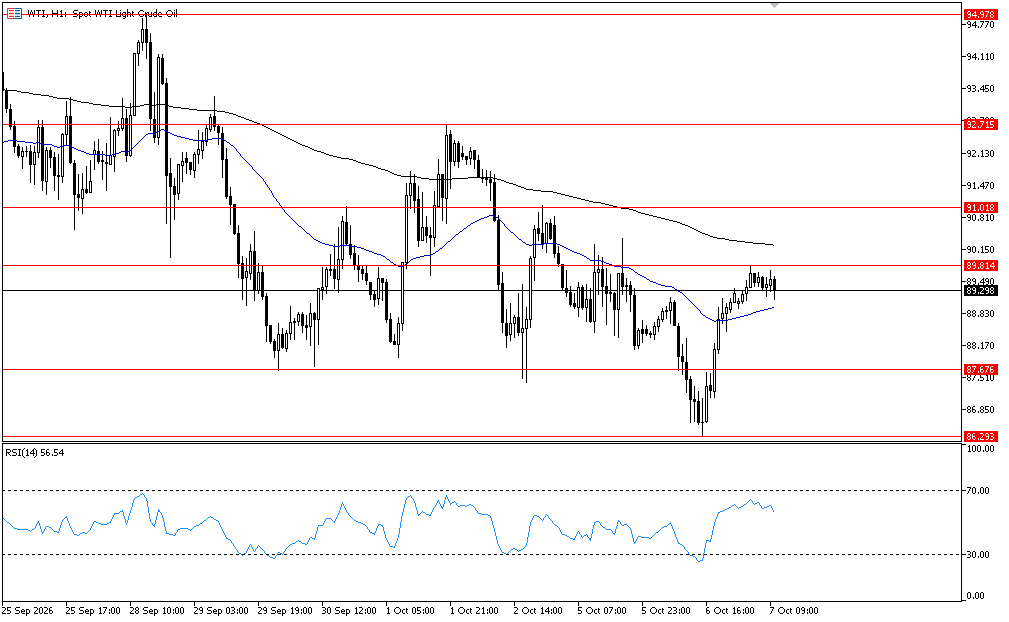
The WTI moves in a downtrend in the one-hour timeframe. It started forming a new high around level 89.80 which supports the continuity of the downtrend and will target level 87.65 then 86.30. The RSI indicator shows the probability of continuing the downtrend by rebounding down off around level 70 near the overbought area.
The bearish scenario will be canceled by breaking up through level 91.00.
Resistance levels:
89.80, 91.00, 92.70, 95.00
Support levels:
87.65, 85.90, 83.80, 81.70
USDJPY
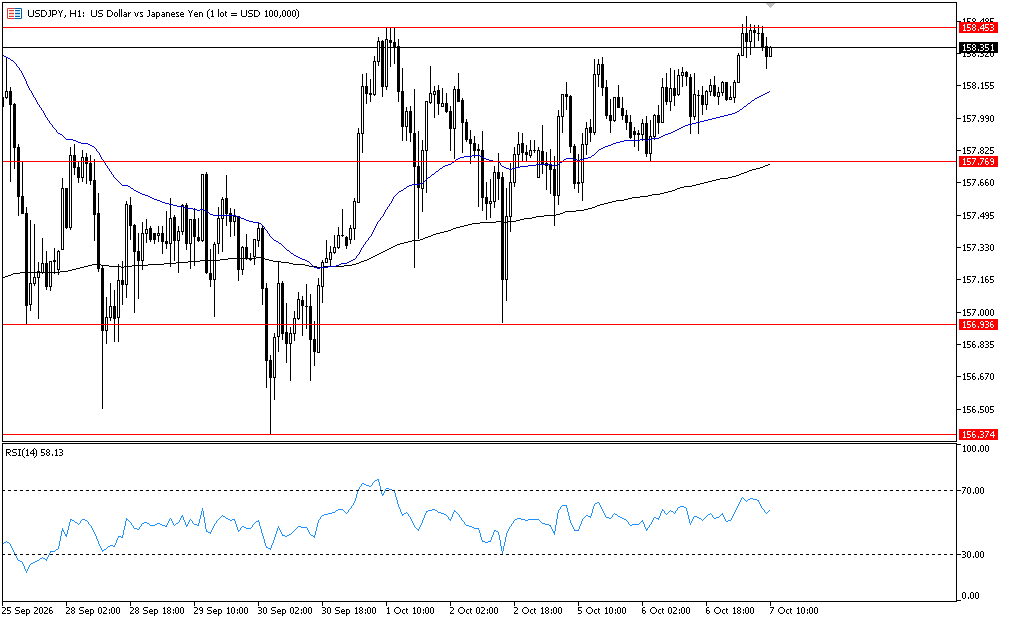
The pair moves inside an uptrend in the one-hour timeframe. It is currently being traded around level 158.45 which is a horizontal resistance level in the hourly timeframe, which by breaking upwards through it will support the continuity of the uptrend and will target level 159.00 then 159.50. The RSI indicator shows the probability of continuing the uptrend by moving around level 50.
The bullish scenario will be canceled by breaking down through level 157.75.
Resistance levels
158.45, 159.00, 159.50, 160.35
Support levels
156.60, 155.35, 154.40, 152.90
GBPUSD
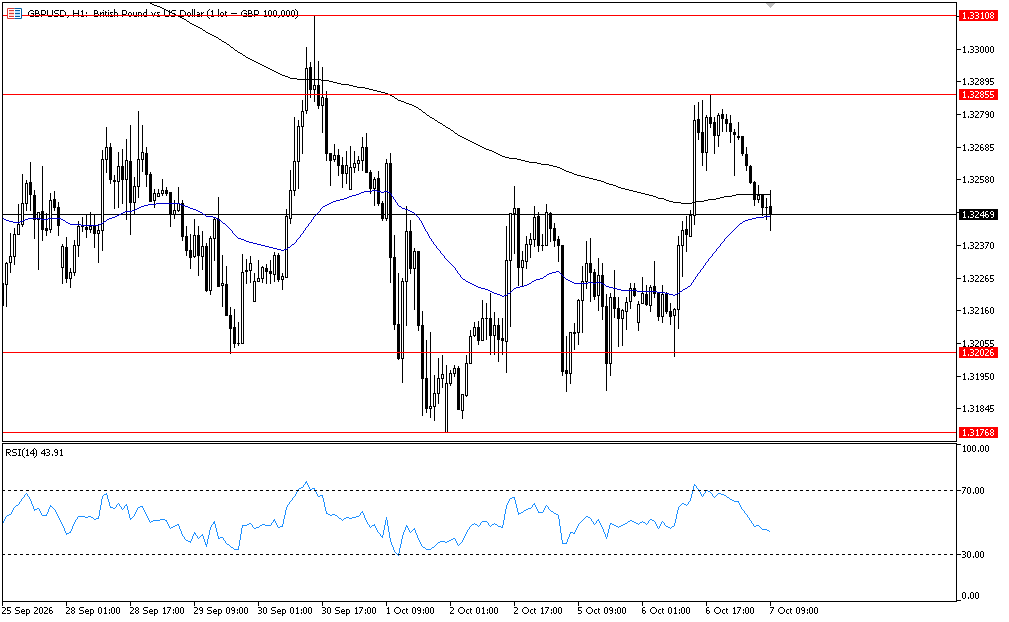
The pair moves inside a sideways movement in the one-hour timeframe. It rebounded down off level 1.3285 which is a horizontal resistance level in the hourly timeframe, which supports the continuity of the sideways movement and will target level 1.3200. The RSI indicator shows the probability of continuing the sideways movement by rebounding down off level 70 the overbought area.
The bearish scenario will be canceled by breaking up through level 1.3285.
Resistance levels:
1.3285, 1.3310, 1.3335, 1.3400
Support levels:
1.3200, 1.3175, 1.3125, 1.3085
USDCHF
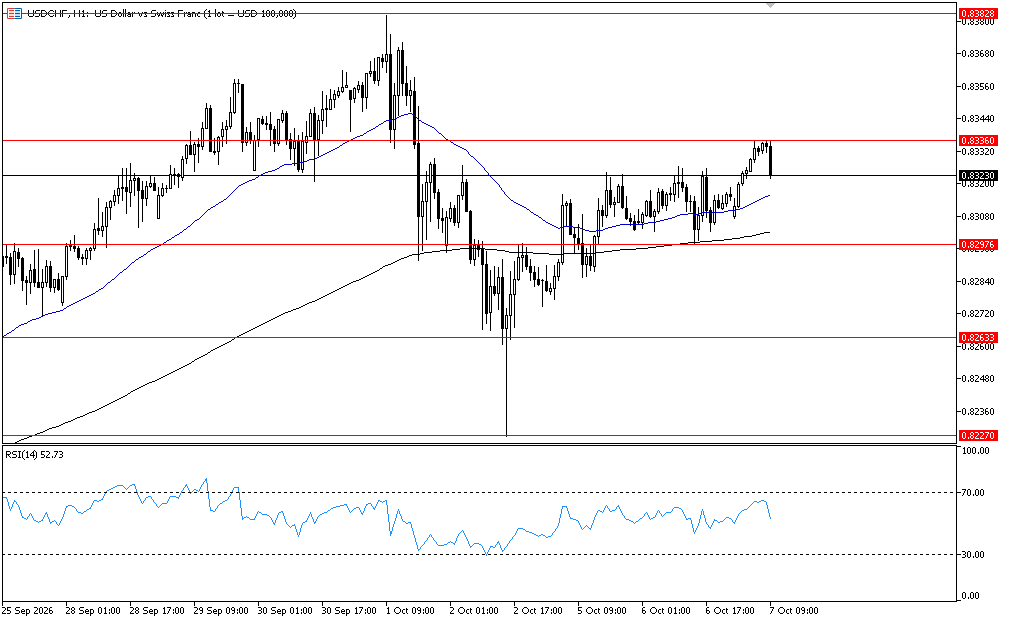
The pair moves inside an uptrend in the one-hour timeframe. It rebounded down off level 0.8335 which is a horizontal resistance level in the hourly timeframe to correct inside the uptrend, which by breaking upwards through it will support the continuity of the uptrend and will target level 0.8360 then 0.8380. The RSI indicator shows the probability of continuing the uptrend by moving around level 50.
The bullish scenario will be canceled by breaking down through level 0.8295.
Resistance levels:
0.8335, 0.8360, 0.8380, 0.8435
Support levels:
0.8295, 0.8260, 0.8225, 0.8180
US30
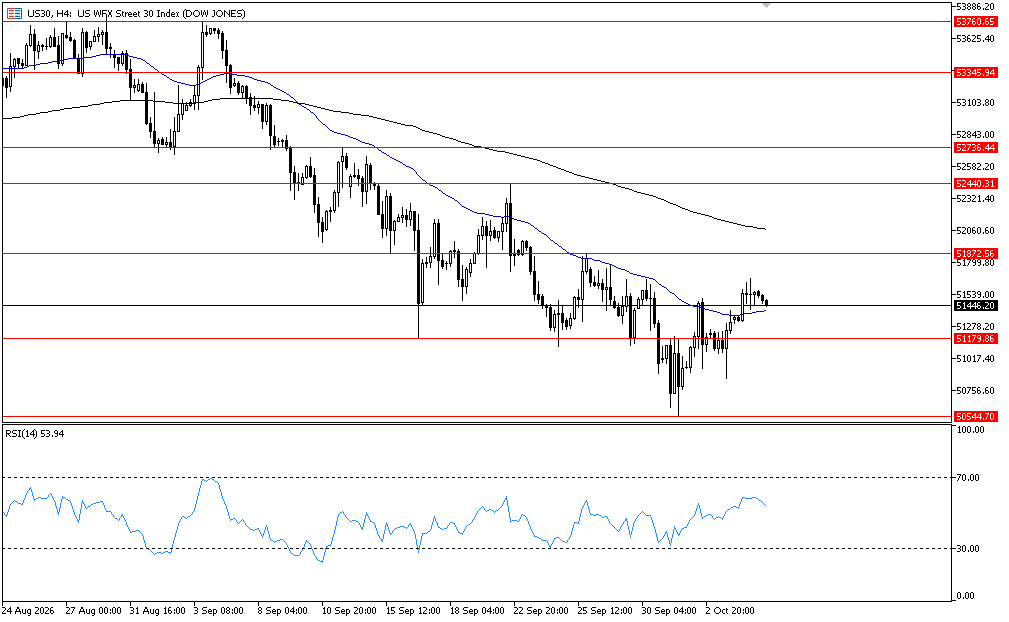
The US30 moves inside a downtrend in the four-hour timeframe. It started rebounding down off around level 51670 which is a horizontal resistance level in the four hour timeframe, which supports the continuity of the downtrend and will target level 51180 then 50550. The RSI indicator shows the probability of continuing the downtrend by rebounding down off around level 60.
The bearish scenario will be canceled by breaking up through level 51870.
Resistance levels:
51670, 51870, 52440, 52735
Support levels:
51180, 50550, 50120, 49745
XAUUSD
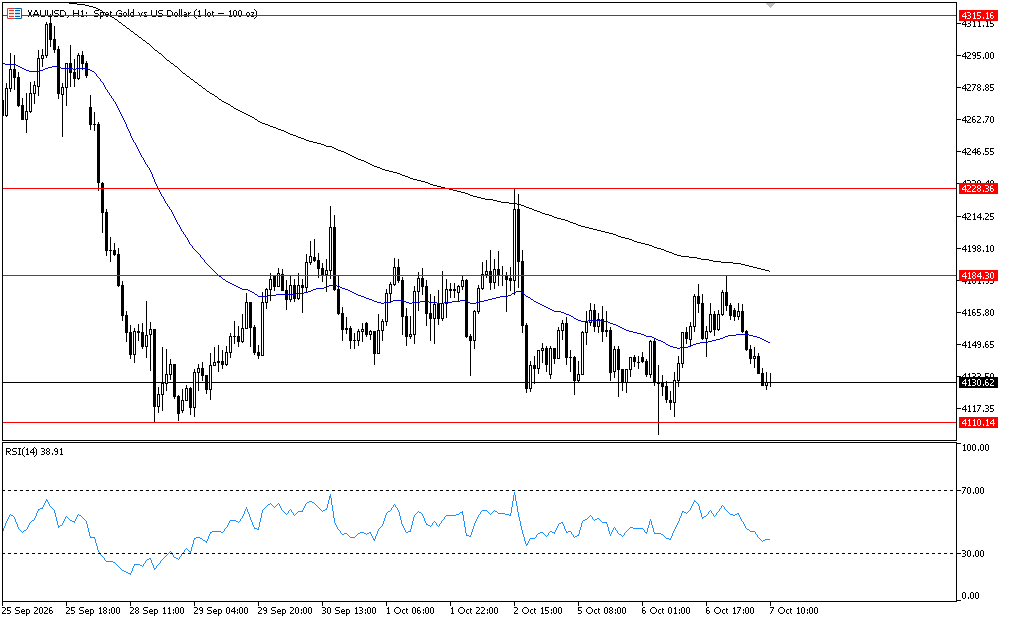
The Gold moves inside a downtrend in the one-hour timeframe. It is currently being traded near level 4110 which is a horizontal support level in the hourly timeframe, which by breaking down through it will support the continuity of the downtrend and will target level 4080 then 4025. The RSI indicator shows the probability of continuing the downtrend by rebounding down off around level 60.
This bearish scenario will be canceled by breaking up through level 4185.
Resistance levels:
4185, 4230, 4255, 4315
Support levels:
4110, 4080, 4025, 3960
Crosses 07-10-2026
GBPJPY
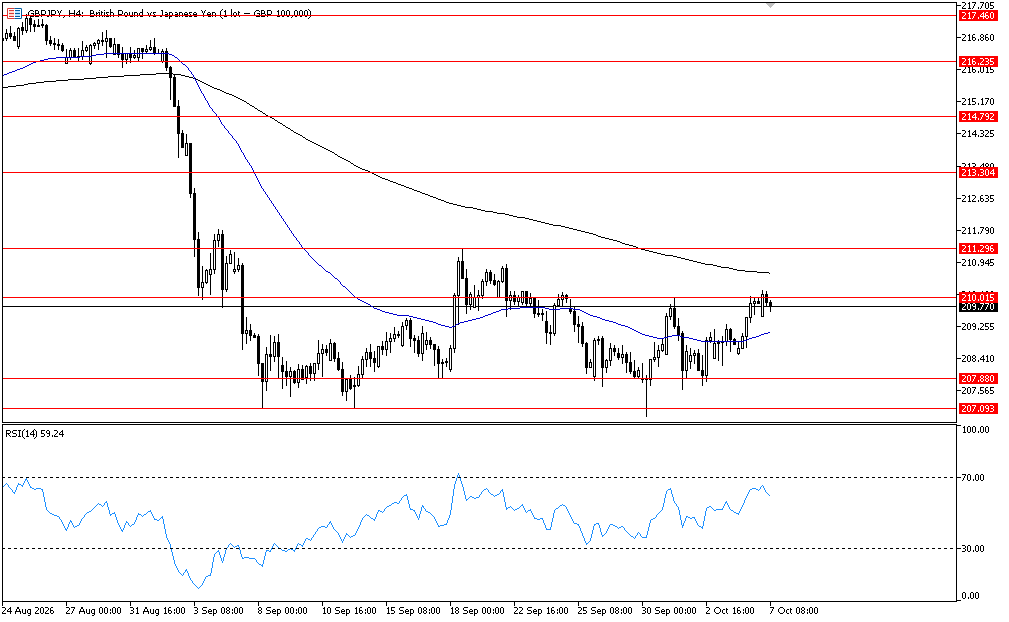
The pair moves in a sideways movement in the four hour timeframe in a downtrend in the daily timeframe. It started rebounding down off level 210.00 which is a horizontal resistance level in the four hour timeframe, which supports the continuity of the sideways movement and will target level 207.90 then 207.10. The RSI indicator shows the probability of continuing the sideways movement by rebounding down off around level 70 near the overbought area.
This bearish scenario will be canceled by breaking up through level 211.30.
Resistance levels
210.00, 211.30, 213.30, 214.80
Support levels
207.90, 207.10, 205.20, 204.15
EURJPY
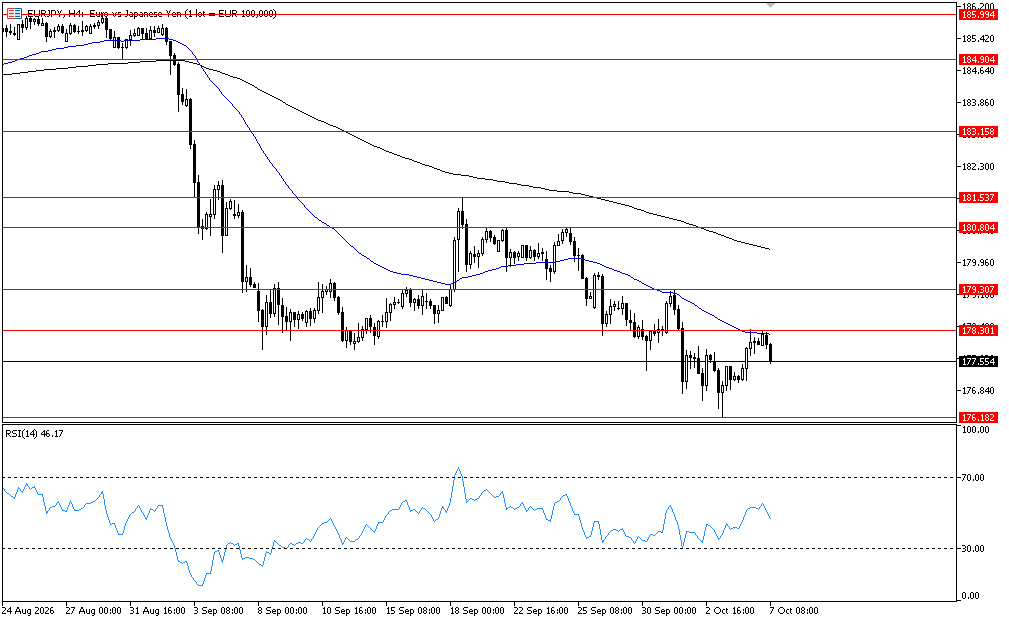
The pair moves in a downtrend in the four hour timeframe, It rebounded down off level 178.30 which is a horizontal resistance level in the four hour timeframe, which supports the continuity of the downtrend and will target level 176.20 then 174.80. The RSI indicator shows the probability of continuing the downtrend by rebounding down off around level 50.
The bearish scenario will be canceled by breaking up through level 179.30.
Resistance levels
178.30, 179.30, 180.80, 181.55
Support levels
176.20, 174.80, 173.45, 172.25
USDCAD
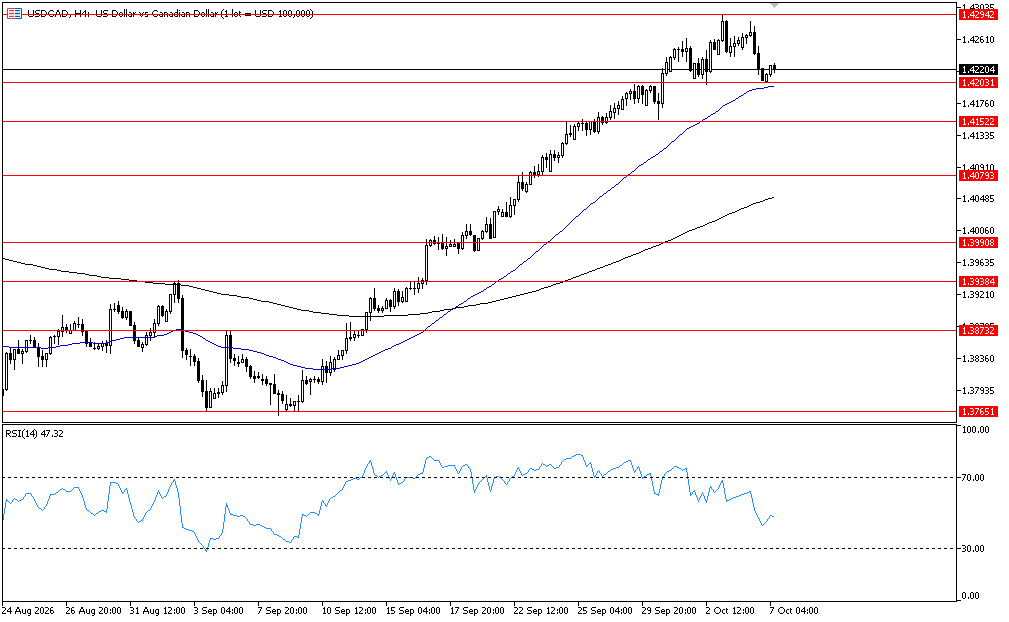
The pair moves inside an uptrend in the four-hour timeframe. It started rebounding up off around level 1.4200 which is a horizontal support level in the four hour timeframe, which supports the continuity of the uptrend and will target level 1.4295. The RSI indicator shows the probability of continuing the uptrend by rebounding up off around level 40.
This bullish scenario will be canceled by breaking down through level 1.4150.
Resistance levels
1.4295, 1.4330, 1.4400, 1.4450
Support levels
1.4200, 1.4150, 1.4080, 1.4030
NZDUSD
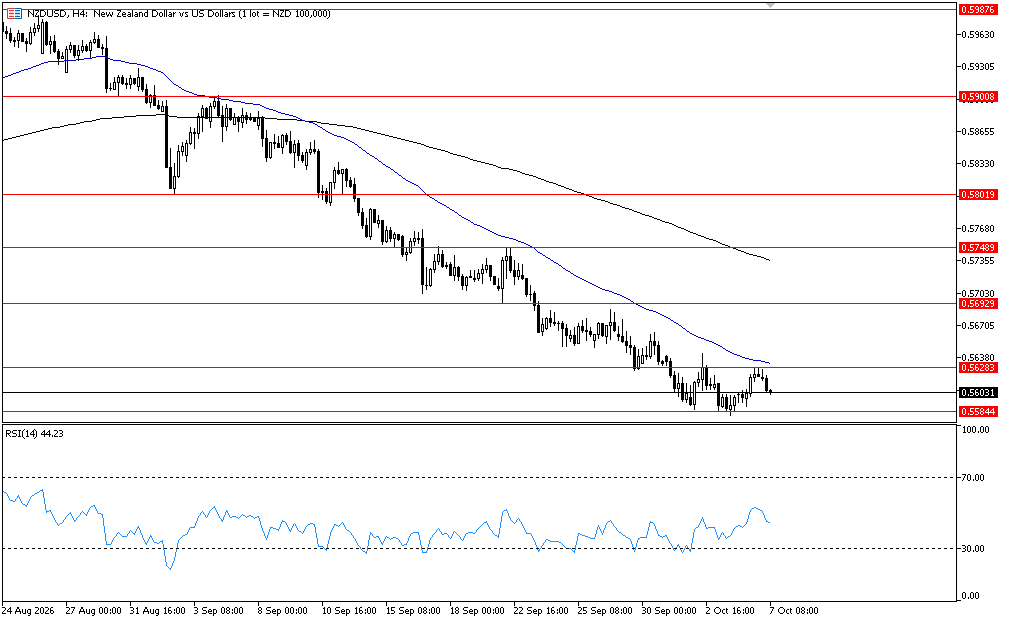
The pair moves inside a downtrend in the four-hour timeframe. It rebounded down off level 0.5630 which is a horizontal resistance level in the four hour timeframe, which supports the continuity of the downtrend and will target level 0.5585 then 0.5500. The RSI indicator shows the probability of continuing the downtrend by rebounding down off around level 50.
The bearish scenario will be canceled by breaking up through level 0.5690.
Resistance levels
0.5630, 0.5690, 0.5750, 0.5800
Support levels
0.5585, 0.5500, 0.5440, 0.5365
EURGBP
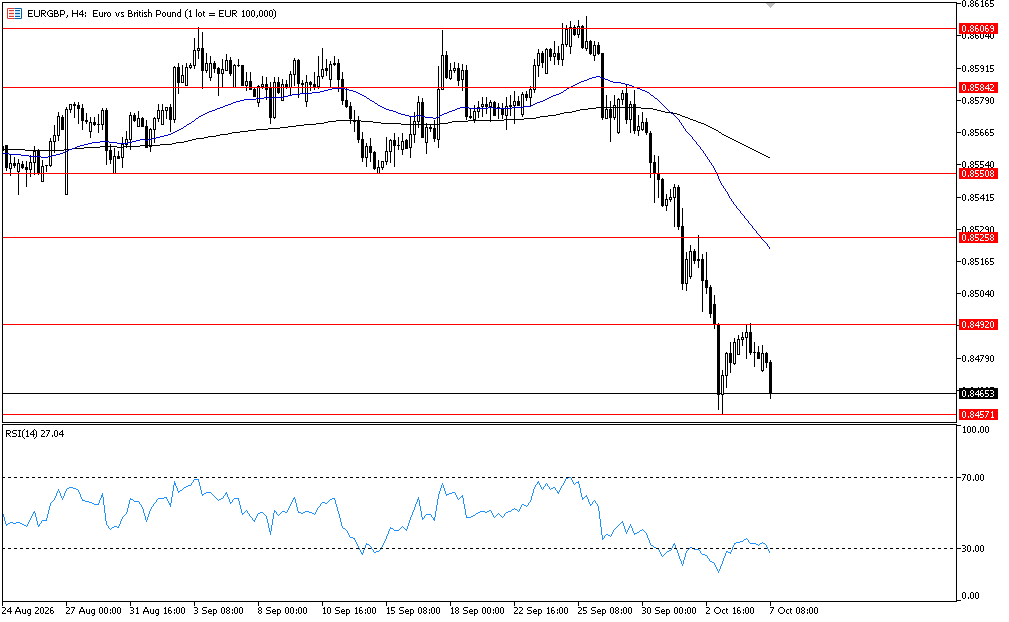
The pair moves in a downtrend in the four-hour timeframe. It is currently being traded around level 0.8455 which is a horizontal support level in the four hour timeframe, which by breaking down through it will support the continuity of the downtrend and will target level 0.8410. The RSI indicator shows the probability of rebounding up off around current levels to correct inside the downtrend by moving below level 30 inside the oversold area.
This bearish scenario will be canceled by breaking up through level 0.8490.
Resistance levels
0.8490, 0.8525, 0.8550, 0.8585
Support levels
0.8455, 0.8410, 0.8355, 0.8315
AUDUSD
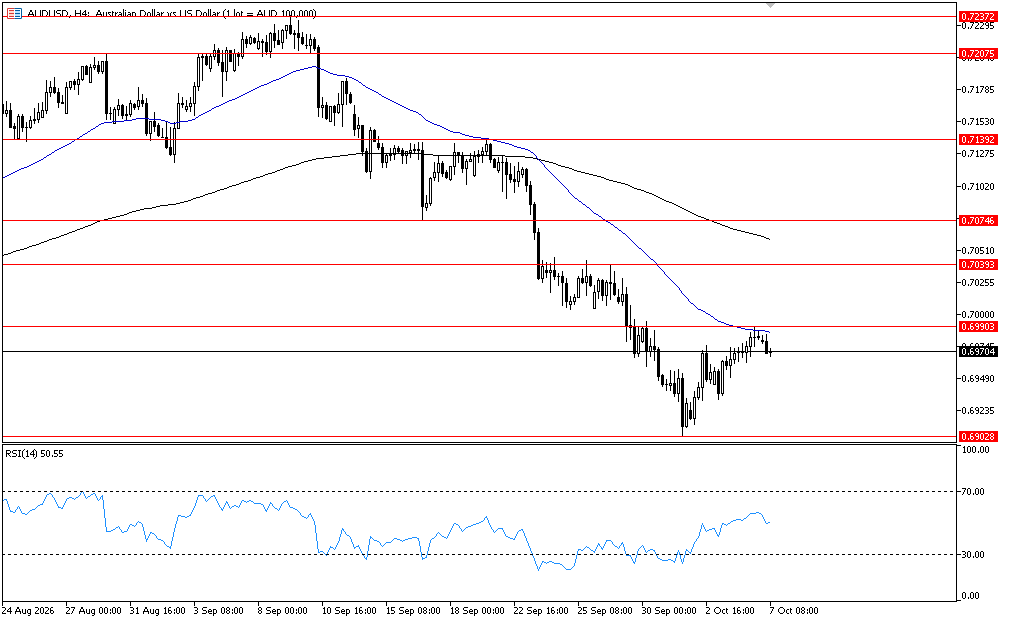
The pair moves inside a downtrend in the four-hour timeframe. It rebounded down off level 0.6990 which is a horizontal resistance level in the four hour timeframe, which supports the continuity of the downtrend and will target level 0.6900 then 0.6865. The RSI indicator shows the probability of continuing the downtrend by rebounding down off around level 60.
This bearish scenario will be canceled by breaking up through level 0.7040.
Resistance levels
0.6990, 0.7040, 0.7075, 0.7140
Support levels
0.6900, 0.6865, 0.6835, 0.6765
US100
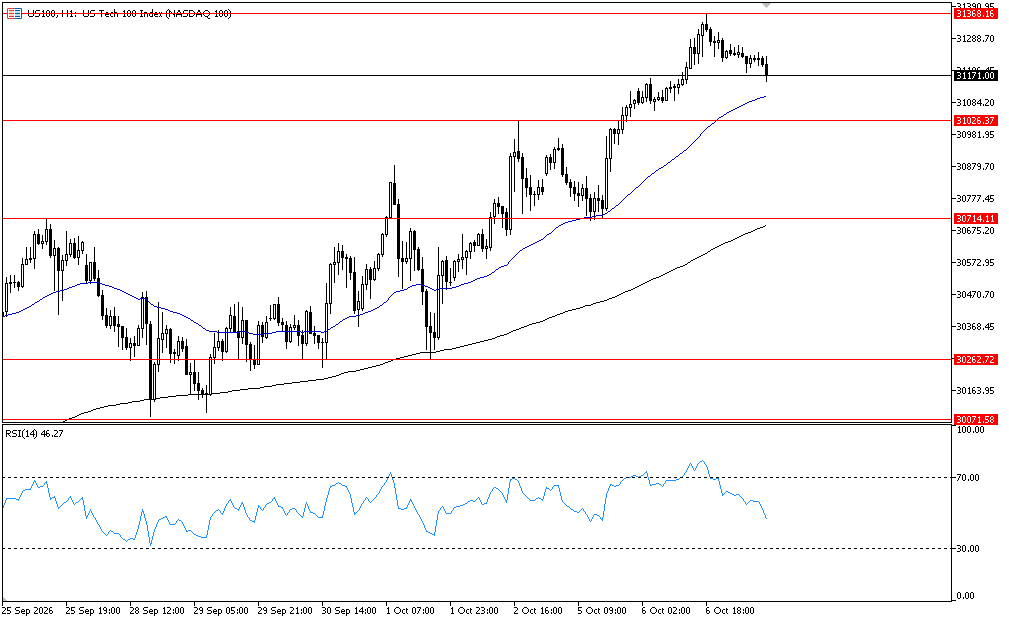
The US100 moves inside an uptrend in the one-hour timeframe. It rebounded down off level 31370 which is a horizontal resistance level in the hourly timeframe to correct inside the uptrend and retest level 31025 which by rebounding up off it or around current levels will support the continuity of the uptrend and will target level 31370 then 31500. The RSI indicator shows the probability of rebounding up off around current levels and continuing the uptrend by moving around level 40.
The bullish scenario will be canceled by breaking down through level 30715.
Resistance levels:
31370, 31500, 31800, 31975
Support levels:
31025, 30715, 30260, 30075
US500
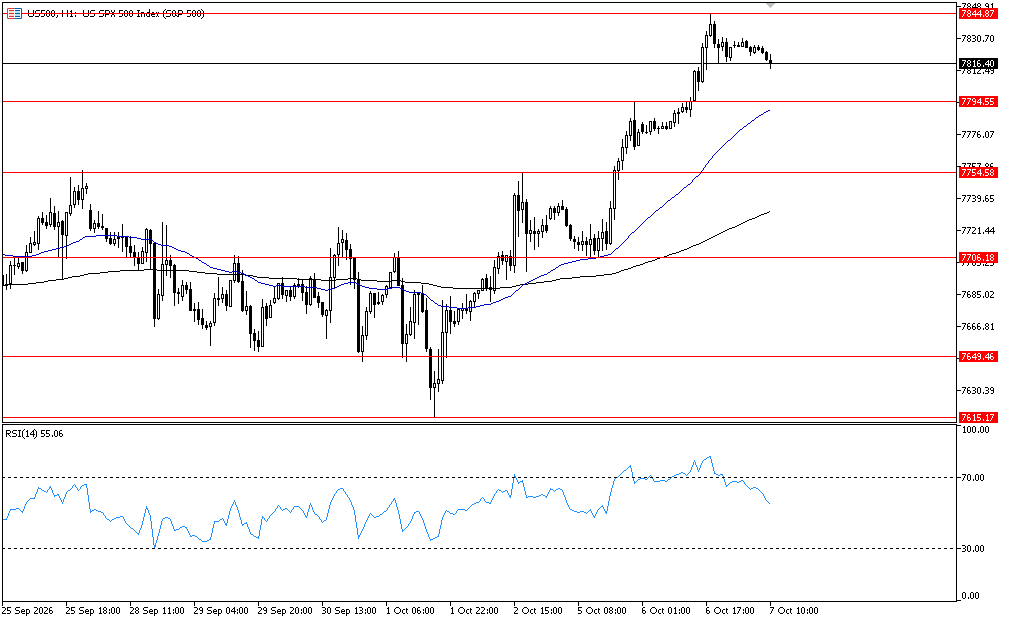
The US500 moves inside an uptrend in the one-hour timeframe. It rebounded down off level 7845 which is a horizontal resistance level in the hourly timeframe to correct inside the uptrend and retest level 7795 which by rebounding up off it or around current levels will support the continuity of the uptrend and will target level 7845 then 7890. The RSI indicator shows the probability of continuing the uptrend by moving around level 50.
The bullish scenario will be canceled by breaking down through level 7705.
Resistance levels:
7845, 7890, 7945, 8000
Support levels:
7795, 7755, 7705, 7650
XAGUSD
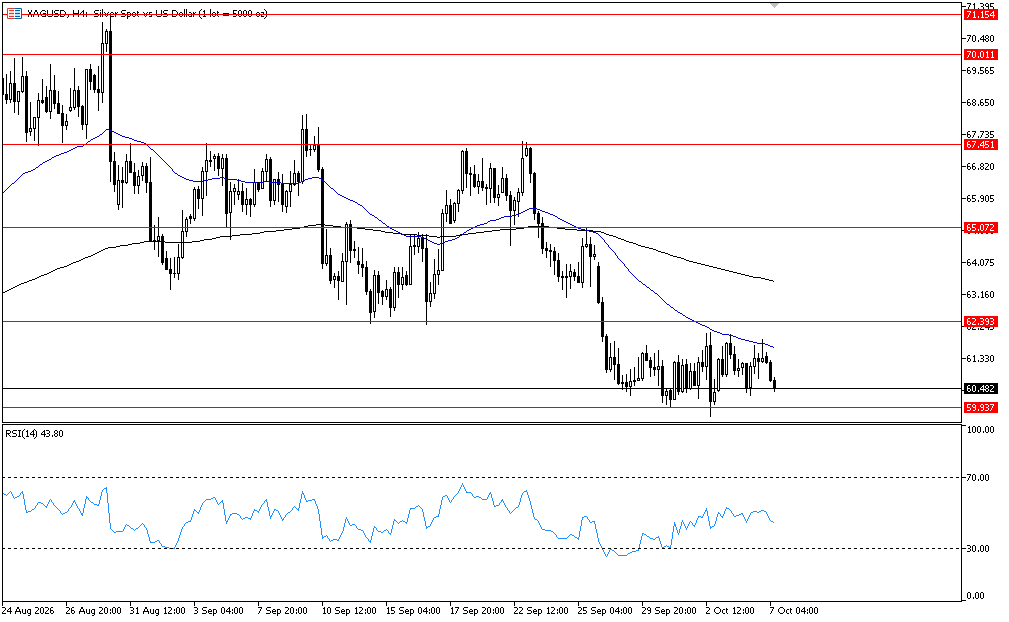
The Silver moves inside a downtrend in the four-hour timeframe. It is currently being traded around level 59.95 which is a horizontal support level in the four hour timeframe, which by breaking down through it will support the continuity of the downtrend and will target level 56.65. The RSI indicator shows the probability of continuing the downtrend by rebounding down off around level 50.
This bearish scenario will be canceled by breaking upwards through level 62.40.
Resistance levels:
62.40, 65.10, 67.55, 69.60
Support levels:
59.95, 56.65, 54.70, 53.00
AUDJPY
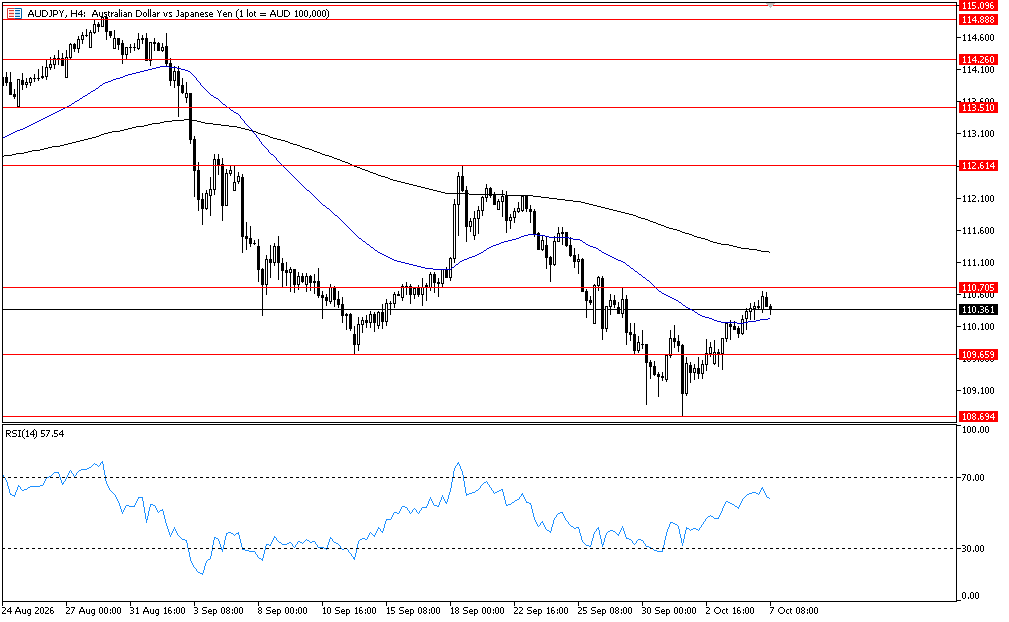
The pair moves inside a downtrend in the four-hour timeframe. It rebounded down off around level 110.70 which is a horizontal resistance level in the four hour timeframe, which supports the continuity of the downtrend and will target level 109.65 then 108.70. The RSI indicator shows the probability of continuing the downtrend by rebounding down off around level 70 near the overbought area.
The bearish scenario will be canceled by breaking up through level 110.85.
Resistance levels:
110.70, 111.65, 112.60, 113.60
Support levels:
108.65, 107.85, 106.70, 105.60
CADJPY
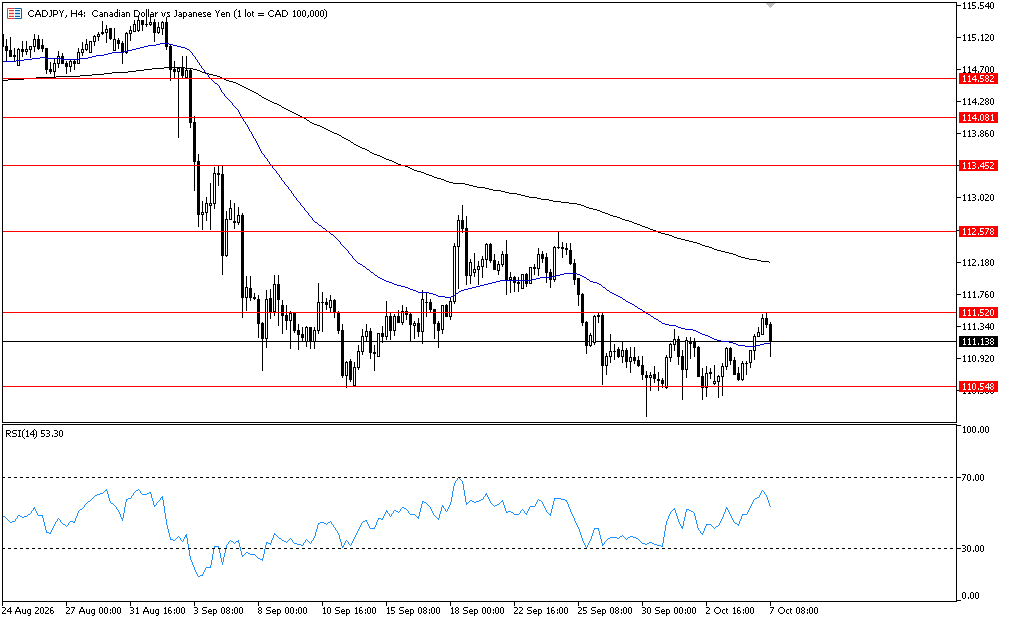
The pair moves inside a downtrend in the four-hour timeframe. It rebounded down off level 111.50 which is a horizontal resistance level in the four hour timeframe, which supports the continuity of the downtrend and will target level 110.50. The RSI indicator shows the probability of continuing the downtrend by rebounding down off around level 60.
The bearish scenario will be canceled by breaking up through level 112.55.
Resistance levels:
111.50, 112.55, 113.45, 114.10
Support levels:
110.55, 109.65, 108.75, 108.20
CHFJPY
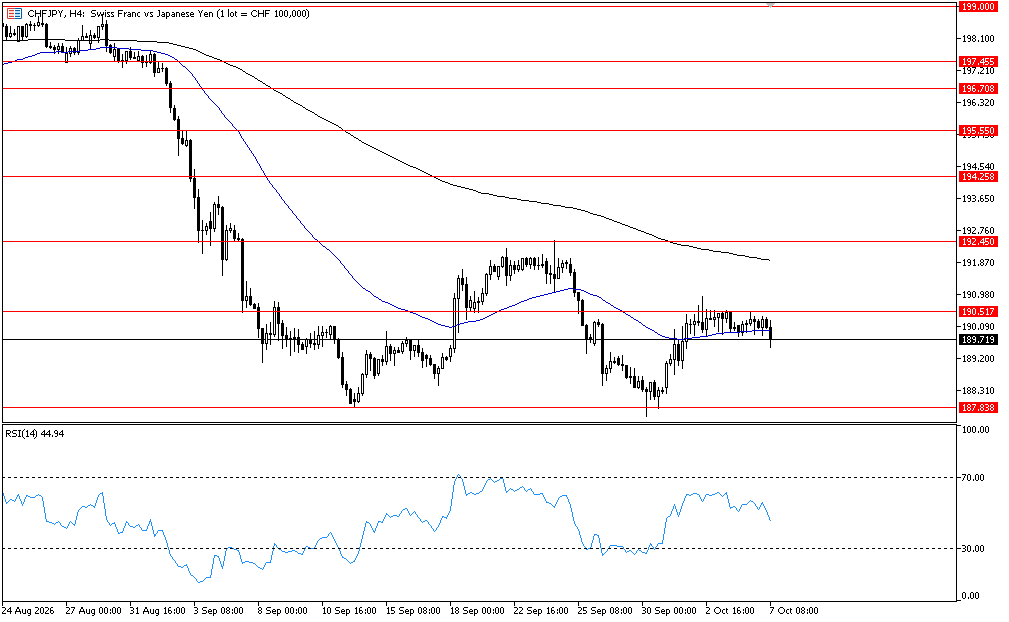
The pair moves inside a downtrend in the four-hour timeframe. It rebounded down off level 190.50 which is a horizontal resistance level in the four hour timeframe, which supports the continuity of the downtrend and will target level 187.85. The RSI indicator shows the probability of continuing the downtrend by rebounding down off around level 60.
This bearish scenario will be canceled by breaking up through level 192.45.
Resistance levels:
190.50, 192.45, 194.25, 195.55
Support levels:
187.85, 185.95, 185.00, 184.00
EURAUD
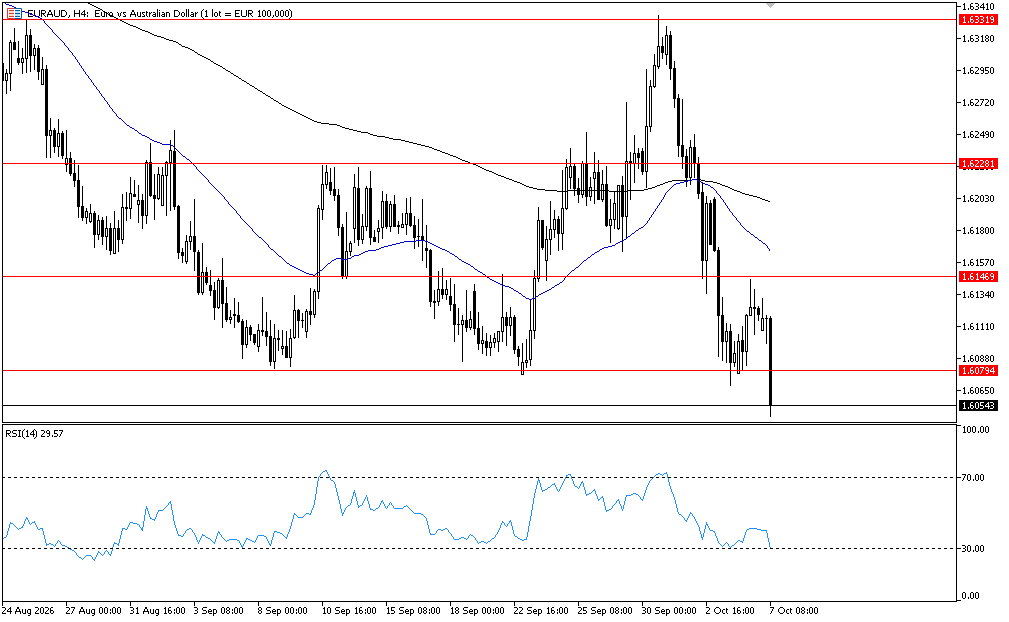
The pair moves inside a downtrend in the four-hour timeframe. It broke down through level 1.6080 which was a horizontal support level in the four hour timeframe, which supports the continuity of the downtrend and will target level 1.6000 then 1.5855. The RSI indicator shows the probability of rebounding up off around current levels to correct inside the downtrend by moving around level 30 near the oversold area.
The bearish scenario will be canceled by breaking up through level 1.6145.
Resistance levels
1.6080, 1.6145, 1.6230, 1.6330
Support levels
1.6000, 1.5855, 1.5750, 1.5690
EURNZD
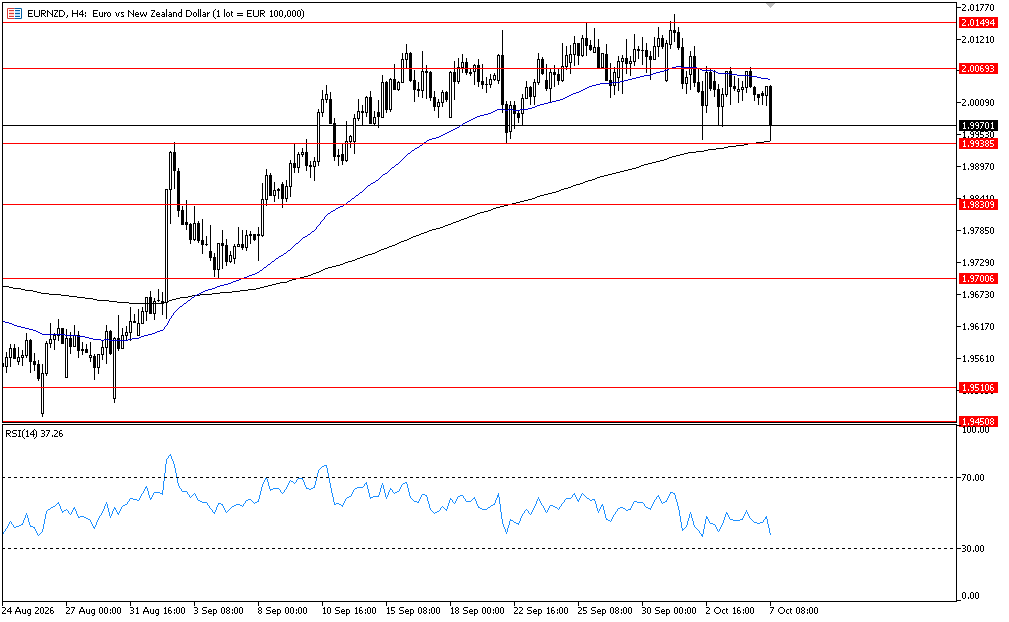
The pair moves inside an uptrend in the four-hour timeframe. It is currently being traded around level 1.9940 which is a horizontal support level in the four hour timeframe, which by rebounding up off it will support the continuity of the uptrend and will target level 2.0070 then 2.0150. The RSI indicator shows the probability of rebounding up off around current levels and continuing the uptrend by moving around level 30 near the oversold area.
The bullish scenario will be canceled by breaking down through level 1.9940.
Resistance levels:
2.0070, 2.0150, 2.0230, 2.0315
Support levels:
1.9940, 1.9830, 1.9700, 1.9630
GBPAUD
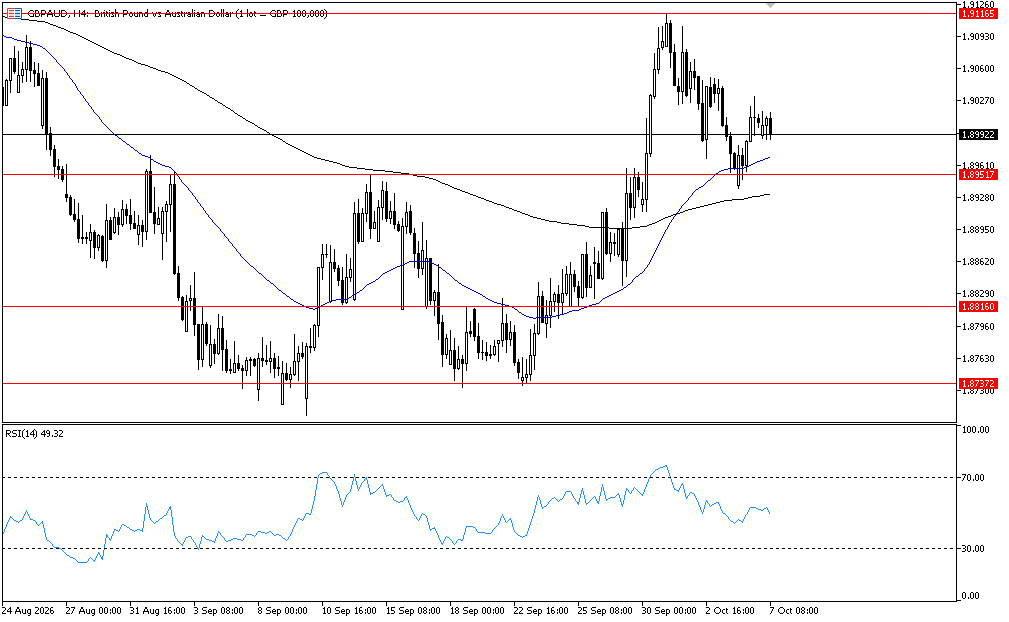
The pair moves inside an uptrend in the four-hour timeframe. It rebounded up off around level 1.8950 which is a horizontal support level in the four-hour timeframe, which supports the continuity of the uptrend and will target level 1.9110 then 1.9185 The RSI indicator shows the probability of continuing the uptrend by rebounding up around level 40.
The bullish scenario will be canceled by breaking down through level 1.8735.
Resistance levels
1.9110 , 1.9185, 1.9260, 1.9355
Support levels
1.8950, 1.8820, 1.8735, 1.8690
Start trading with Wafra Capital today
Open your account in minutes, or try the platform first with a no-obligation demo account.